
How to… create a Running Total
Table calculations in Tableau Desktop are a great way to analyse your data and find different stories and insights. Table calculations use the dimensions in your view to understand what calculation you want to run. This logic doesn’t exist in Tableau Prep as you don’t have a view. You may want to simplify the complexity of your analysis in Desktop by forming some of the calculations as you prepare your data. This post looks at the steps you need to take to make your data set easier to use for analysis.
What are you trying to achieve?
Running totals take a measure and add the previous value on to the data point being assessed. This process continue building the total up until the calculation reaches the end of the data set or you limit it in some way.

Running Totals are useful to remove lots of the noise in a data set. In the above below I’m showing monthly sales which, despite being quite aggregated, still has a lot of fluctuation in the values.

Turning this value into a running total shows there is actually a lot of consistency that you don’t see when looking purely at a month-by-month view.
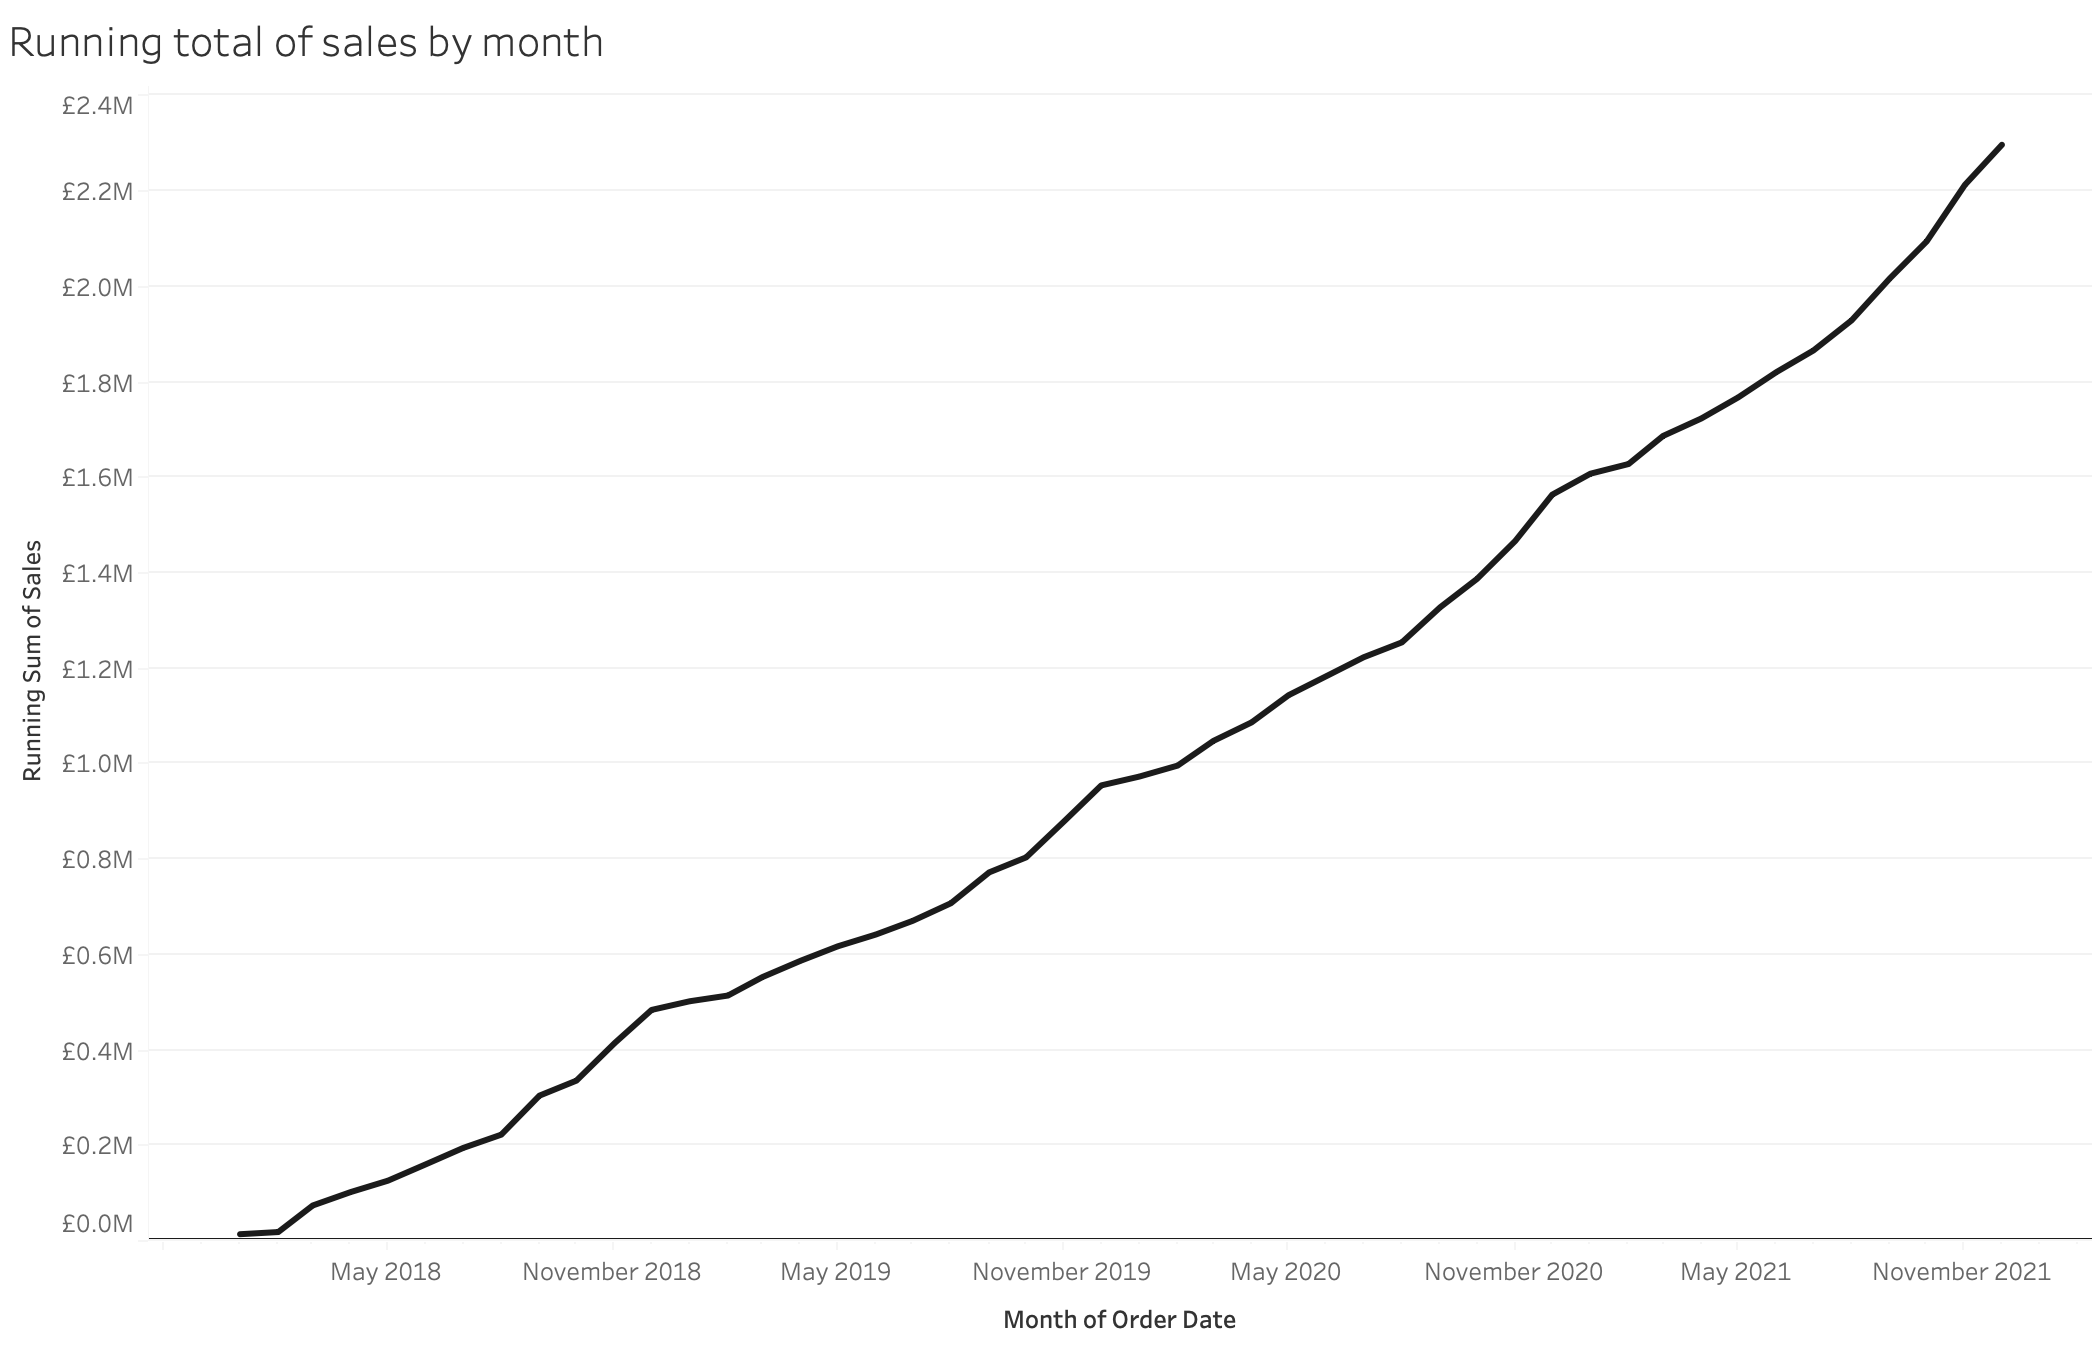
Running totals are therefore useful to convey an alternate message in your data but how do you form them in Tableau Prep?
Building running totals in Prep
Let’s try and replicate the final chart in the section above but in Prep. At the time of writing, Prep doesn’t have the ability to run calculations across multiple rows. Otherwise, you could sort the dates in order and then create a new data field that adds the current row value to the previous total reached.

Logic for creating the running total.

This is the logic you need to replicate within Prep but without being able to reference two different rows at the same time you need to take an alternate approach.
The way to aggregate multiple rows of data in Tableau Prep is to use an Aggregate step. An Aggregate step allows you to sum up any values across the whole data set or for a specific category or categories. Therefore, to make a running total, you need to create all the rows of data you need for each categorical member. In this example, we need to create all the rows that go into our running total for each date. The image below shows the data structure you need to create (the blank rows are there to show the structure more clearly but won’t be in the data set you create).

Creating the repetitive rows
You can use Joins in Prep to create these additional rows. Prep allows you to set Join conditions that involve other operators than equals. There’s more detail in this blog post if you haven’t used this technique before. For this example, I am using an older version of Superstore but the logic is still the same.
You need to aggregate your data to the level of granularity that you will create your running total by. This will be each unique data in the data set for this example. Let’s use an Aggregate step to do this. This will remove a lot of the columns in the data (making this example easier to follow I hope. You can always add them back with a join later). I’ve change the Sales data field to be called Daily Sales for clarity.

Next create a Clean step to provide the duplicate dates and sales figures that will be used in the next step. I changed the data fields names to make it clearer in the next Join step as to what field comes from where.

Now is the time to create the additional rows that will be aggregated to form the running totals. You will join the data coming out of the Aggregate step to the data set coming from the Clean step.

You can use an inner join for this but you will need to change the join clause that Prep automatically picks up. The operator used needs to pick up the current row and all rows previous to it. Therefore, a less than or equal to ‘<=’ operator needs to be used.

The result of this join when viewed in a Clean step’s profile pane is clear to see. There are 1,236 different dates in this data set and that is how many rows you should have in your duplicate date column for the first date in your data set. In this case, this is 3rd Jan 2016. When looking in the duplicate date column, this is why you see 3rd Jan 2016 having 1,236 rows. This is because this record will need to be used in it’s own running total as well as all subsequent date’s running totals too. The next record, 4th Jan 2016 will have 1,235 rows of data.

Calculating the running total value
Now that you have all of the records you need, you can sum-up all the records for each individual date. You will need to Group By the Order Date and Aggregate both of the sales columns. Sum up the Duplicate Sales to form your running total and average Daily Sales to leave the sales number untouched despite the duplication to allow you to validate the results you are getting.

This is the running total that you will be left with although you can’t sort the data pane order in Prep Builder. You could add these columns back on to the original data set using a Join on Order Date if required.

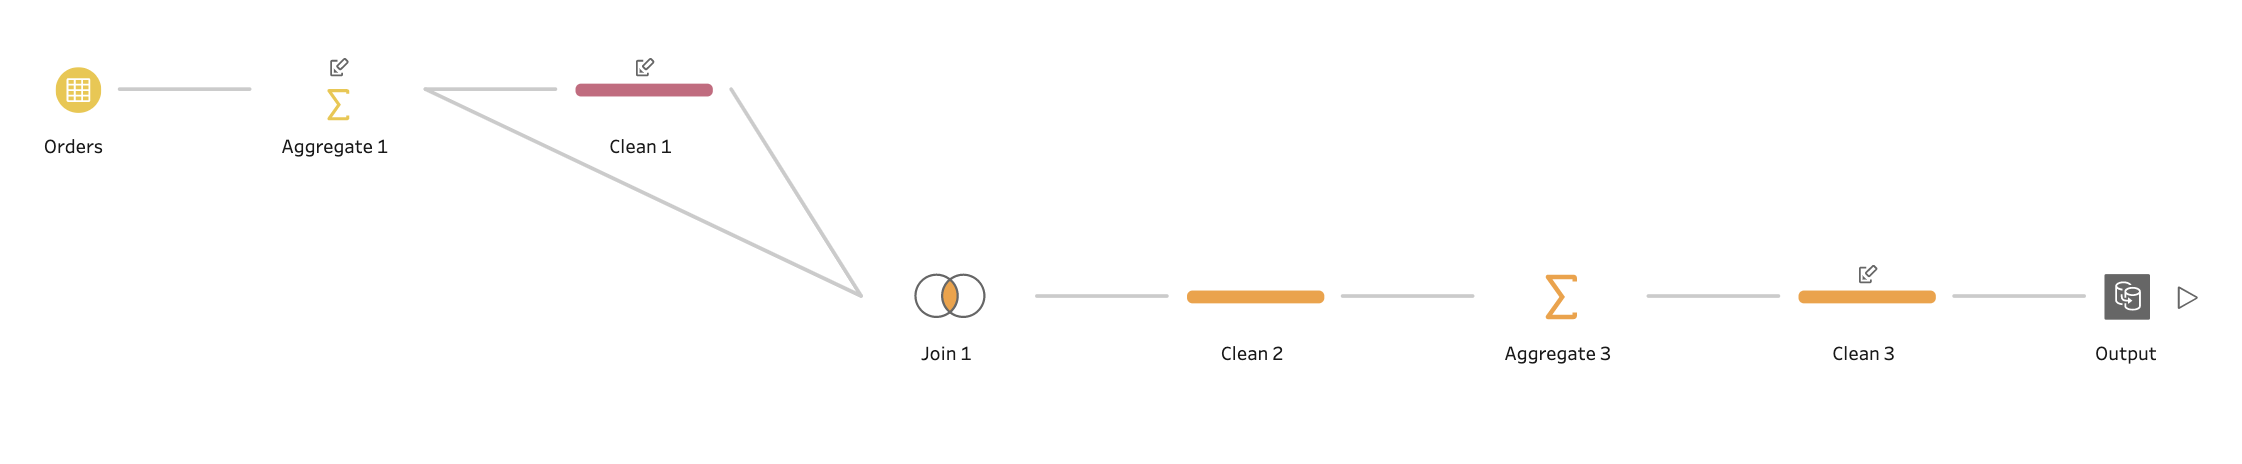
Here is the completed workflow:
Here’s the data visualised in Desktop to show the view without having to use any Table Calculations.
