
How to… make complex calculations easier
Working with data still isn’t easy. Yes, data has become much more accessible for most people in organisations and in their everyday lives but it still isn’t easy. Having software focus on making data easier to use changed my life (thank you Tableau) as they have made it easier for this history and politics to channel their curiosity into questions which can be answered with data rather than opinion.
Not everything has become easier as the software develops. To allow more people to address their wide-ranging issues, more complexity has snuck into even those tools that are heavily focused on being easy to use. Calculations, table calculations and level of detail (LoD) calculations are for many people the first stumbling block they come across in Tableau. Their typical blockages are:
What function should I pick in a calculated field to do what I need?
What is the set-up of the table calculation so I form the right answers?
What even are level of detail calculations and when would I need to use them?
My day job is training people to use Tableau and become fully aware of the tool and what it is doing when you drag & drop or form a calculation. We have to spend a lot of time forming experts so shouldn’t it all be easier? Yes, it should but here are some of the ways I use Tableau Prep to help people remove complexity for themselves when using all types of calculation.
Why do I need a calculation anyway?
Maybe you don’t!
Whenever you use a data set and you are able to drag & drop everything you need to answer your questions then you don’t need to think about calculations. This is where Tableau is at it’s easiest, letting you explore a data set and find answers that would be hidden within a copious amount of rows of data of a spreadsheet or database table.
You will need to use one of the forms of calculations when you want to use a data field that doesn’t exist within the data but could be formed from the current data set you have.
What type of calculation should I use?
When you find you need to form a calculation you need to know what type of calculation to use. Here is a VERY brief summary that should help point you in the right direction:
Calculated Field: Could you form the new data field from values of other data fields on the same row?
Table Calculation: Have you got the data aggregated to the level of granularity you need but want to ask a secondary question of the data?
Level of Detail calculation: Do you need Tableau to calculate values at a different level of granularity to what is being used in the view or the most granular level in the data set?
Now there are some complex concepts that I am skipping over here but there are many other blogs (some on this site!) that will help you understand more about each calculation type.
So how are we making complex calculations easier?
Well on a blog about Tableau Prep, you might already know the answer… it’s using Tableau Prep.
Tableau Prep has a number of features that have made some of the common complex calculations much easier to form and then edit rather than writing out a perfectly syntaxed calculation first time (especially if you are newer to the tool). Let’s look through a selection of places where Tableau Prep will do the hard work for you:
Date Part calculations
I love how Tableau treats dates. After using SQL to form each part of a date that I needed, it’s nice to be able to use Tableau Desktop to explore dates dynamically with slices by weekday, week number or quarter without having those present in the data set. Sometimes you won't want to export the full date as you may need to have a weekday or other part of a date written into the data set.
Using Superstore (the data set shipped with most Tableau products), let’s convert Order Date to the weekday where each order was made.
By clicking on the ellipsis menu (…) in the top right corner of each data field on the Profile Pane, you will be able to select Convert Dates then Day of the Week.

This converts the Order Date into the name of each week day and shows how many rows fall into each weekday.
Note: If you want to keep the original date field as well then select Duplicate Field in the ellipsis menu before converting the date to weekday.

By turning calculations into clickable actions then it removes the need to master the calculation syntax (the structure of the calculation when you type it out). However, you are likely to eventually customise these calculations to solve a more complex problem. A great way to learn what Tableau Prep has done behind the scenes is to look at the calculation the programme has written to form the revised data field. You can do this by clicking the rectangle with the equals sign over it in the top-right corner of the data field in the Profile Pane. This will open up the Changes Pane and you can edit the calculation from here.

By clicking on the pencil icon you will be able to see the calculation editor. If you have used Tableau Desktop, this will look very familiar as it has a very similar appearance and functionality as that in Desktop.

In this case, Tableau Prep has used a DATENAME() function on the Order Date field to extract the weekday. If you are new to using date functions in Tableau or any other data software then this is useful knowledge for the future as to how these calculations are formed and what it is doing. If you want to know more about date calculations then I’d recommend you check out this blog post on how to work with dates or this one on more detail about date parts.
Splitting up string fields
Again Tableau Prep has this functionality built into a few clicks but exposing the underlying calculation can help you both understand what Tableau is doing but also address issues when the functionality hasn’t worked as you have expected.
To split up a string field, you can again head to the ellipsis menu in the field that you want to split in the Profile Pane. Let’s use Order ID to show what’s going on.

I’m going to select Automatic Split in this instance but if you want to know how to use a Custom split then check out this post.
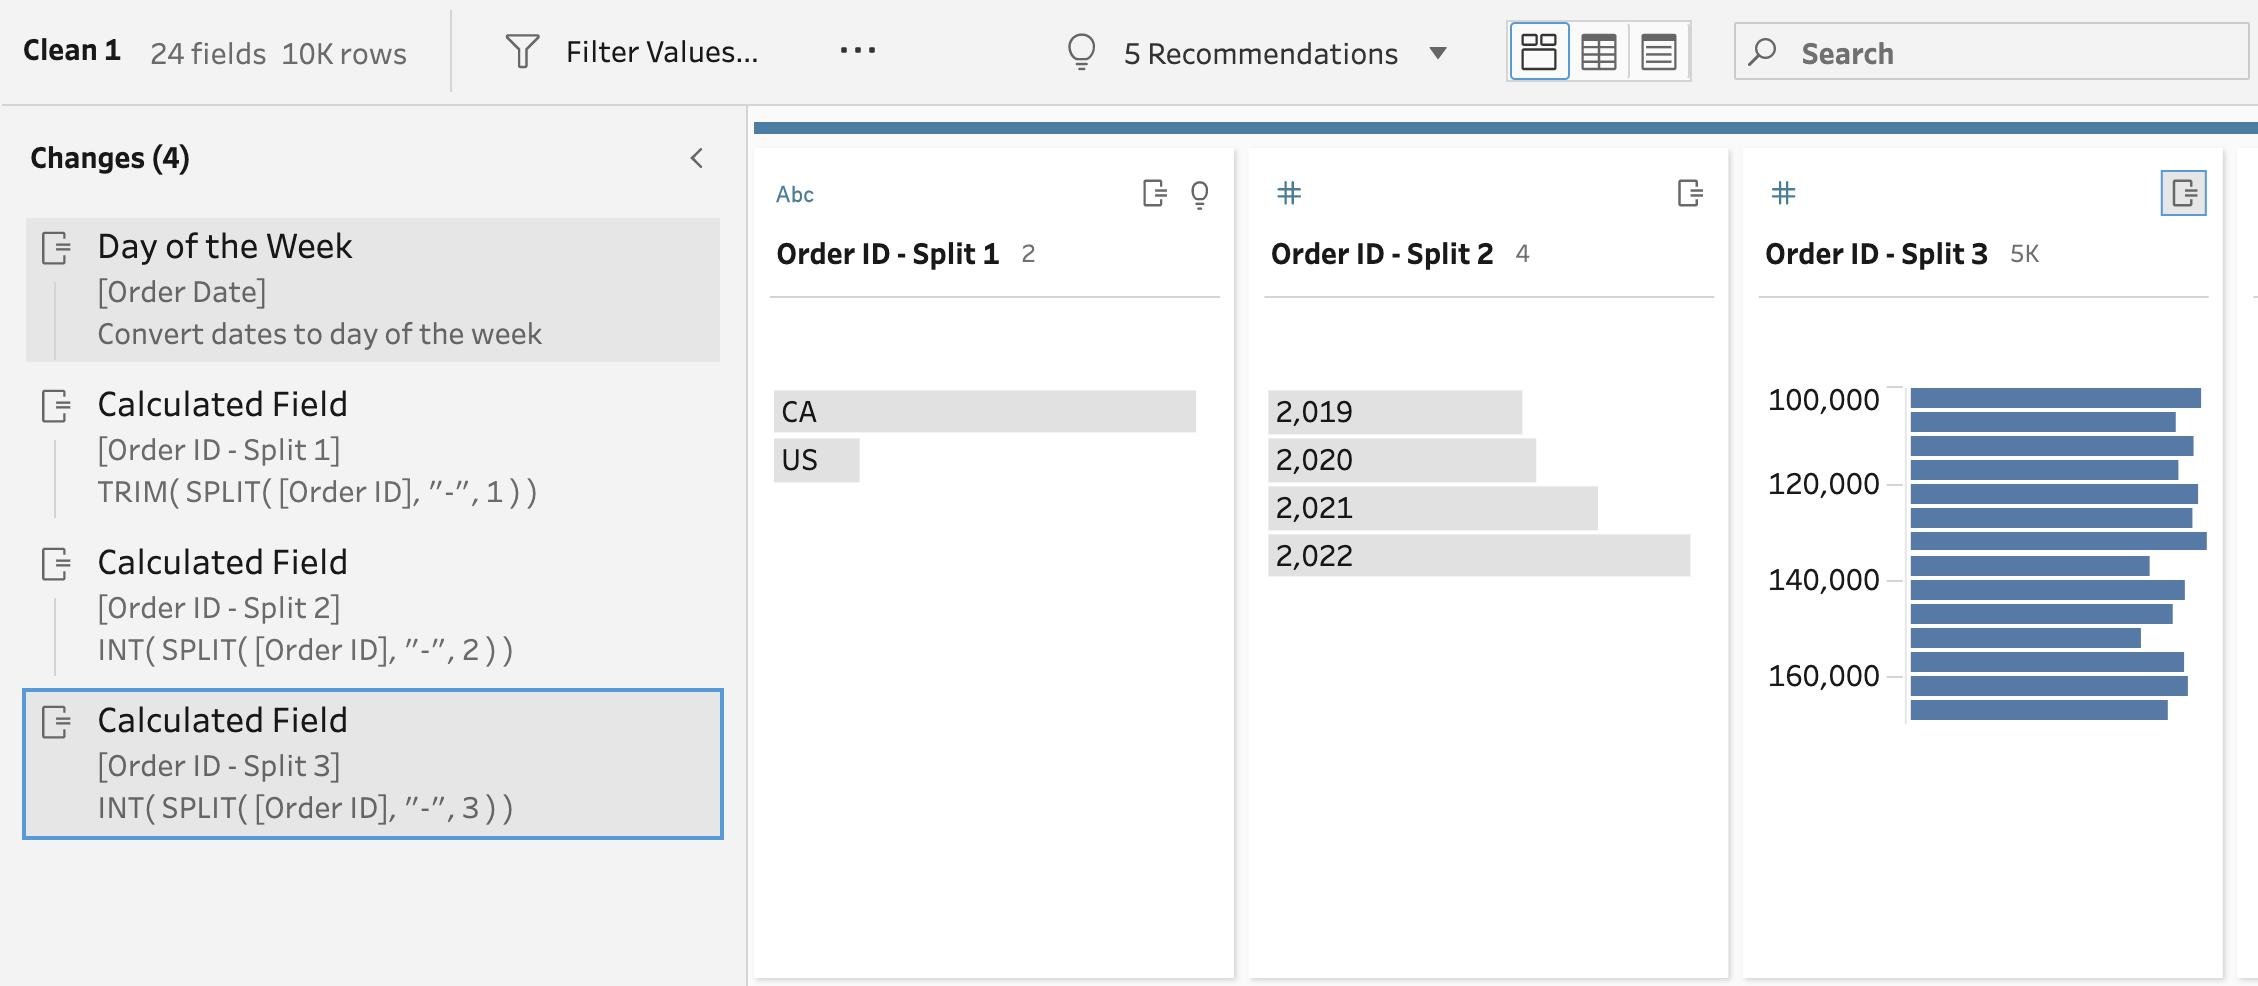
In this instance, Tableau Prep has recognised that there is a hyphen character separating three separate pieces of information in the Order ID field. Tableau Prep has split out these pieces of data into three separate data fields using a separate calculation for each. What’s useful about the split calculation is that you can see each of the calculations that have been written in the Changes Pane. The calculation is very similar for each data field created with the exception of the final numerical value in the calculation. The first data field split out ends with 1, the second with 2 and the third with 3. Coincidence… none at all.
The calculation is using the SPLIT() function to break up the Order ID field whenever it finds a hyphen. The hyphen is in speech marks (“ “) as Tableau is capturing the character that it is splitting the field by. This is known as a delimiter. The final value is setting which part of the broken up field is the calculation returning to form the new data field. 1 captures all the characters in the string before the first delimiter. 2 captures all the characters after the first delimiter and before the second. This means you don’t need to form multiple calculations if you know that you just need one part of the field for your analysis. On much larger data sets this can save a lot of computational power and time.
Table Calculations
In Tableau Desktop, table calculations allow you to take an aggregated measure and ask a further question. What I mean by this is you might have the sum of sales by Region but you then want to work out for each Region what percentage they make up of the total sales across all regions.
For Tableau Desktop, the dimensions you have within your view will change how that calculation works and potentially the answer too. As you are not forming analytical views in Tableau Prep how can the concept of a table calculation still exist? Primarily it’s because the questions you might be asking of the data is still valid in Prep as much as Desktop but you want to ‘hard code’ the answer so the values are not affected by how the data is used.
Currently only Rank and Tile (short for Percentile) are possible within Tableau Prep without creating a complex workflow. You can get to both options by selecting the ellipsis menu of the data field you want to form the calculation on, going to Create Calculated Field and then selecting the calculation type you want to use.

You are presented with a different dialogue box than what you might be expecting at this point. This is the Visual Calculation Editor that is used in Tableau Prep for table and LoD calculations.
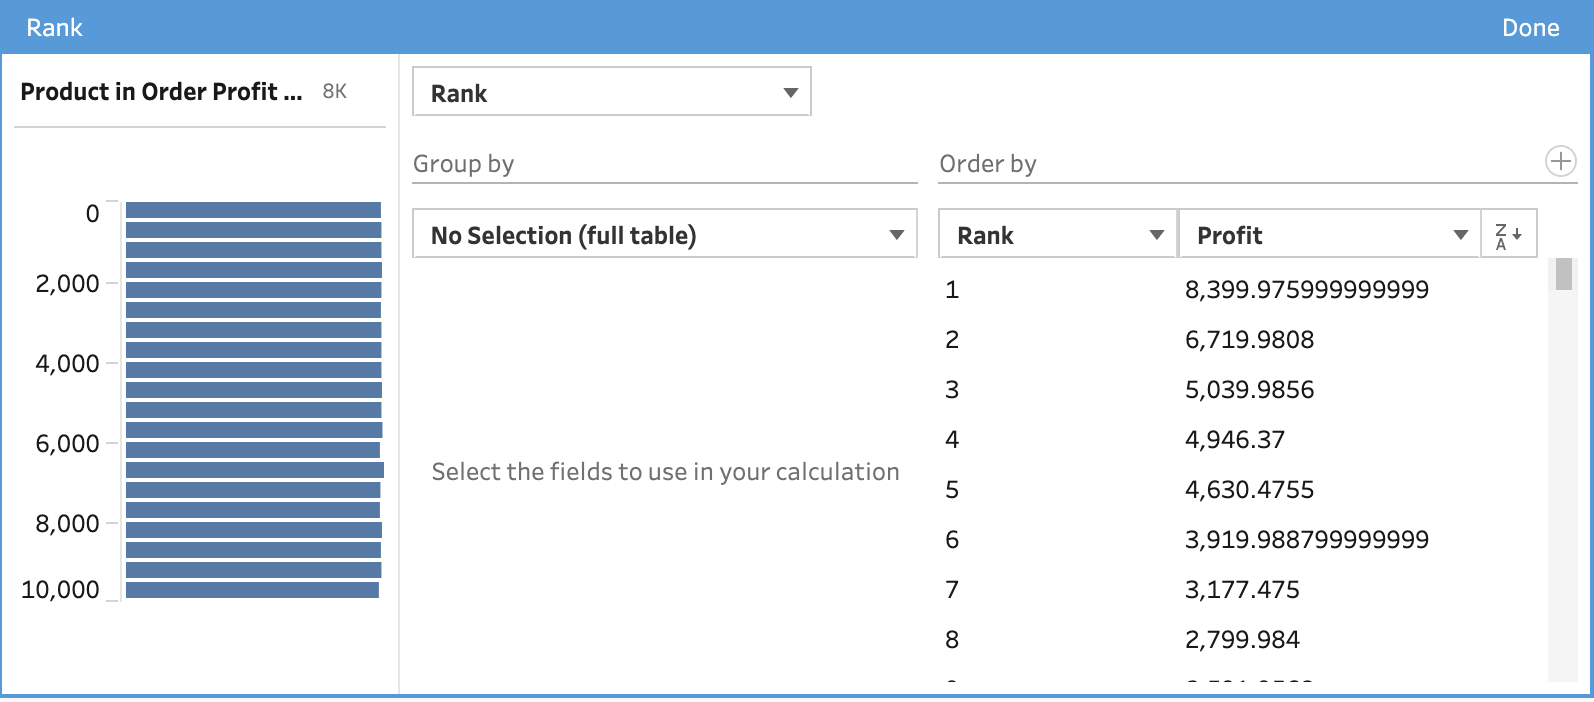
The visual editor makes these more complex forms of calculation much clearer as you can see what is happening to the values, what is being assessed by the calculation and you can even choose to factor in other categorical fields into the calculation if you need to. If you want more detail on how to use the visual editor (or specifically create Tiles) this is the blog post for you. Like other calculations Prep has helped you to form, the tool will show you what calculation is being written.

The difference with these calculation is when you go to edit them, they will open in the visual calculation editor rather than normal calculation editor shown earlier in this post. This means creating more complex versions of these calculation has to be started from scratch but at least you know how this one is formed. The syntax in the table calculations is very unique to what we have in other calculated fields so if you are anything like me you will appreciate the help! You can build these calculations from scratch in the text version of the calculation editor if you want to do something more detailed but this isn’t easy so approach with caution.
Level of Detail calculations
There are three types of Level of Detail (LoD) calculations in Tableau Desktop but only one of them appears in Tableau Prep. Exclude and Include are not available as they rely on the dimensions in the view. As some table calculation (that also rely on the dimensions in the view) have made their way into Tableau Prep this may change over time but is true at the time of writing (version 2022.3).
Fixed is present within the tool and allows us to create aggregations across multiple rows in the data set being prepared without having to use an aggregation step and rejoin to the original data source.
To set up a fixed LoD calculation, you access it through the same Create Calculated Field option in the ellipsis menu as before. You will be able to use the visual or text calculation editor. To calculate the total sales made in each region, you can use the visual editor but add a Group By field of Region and change the aggregation to Sum.
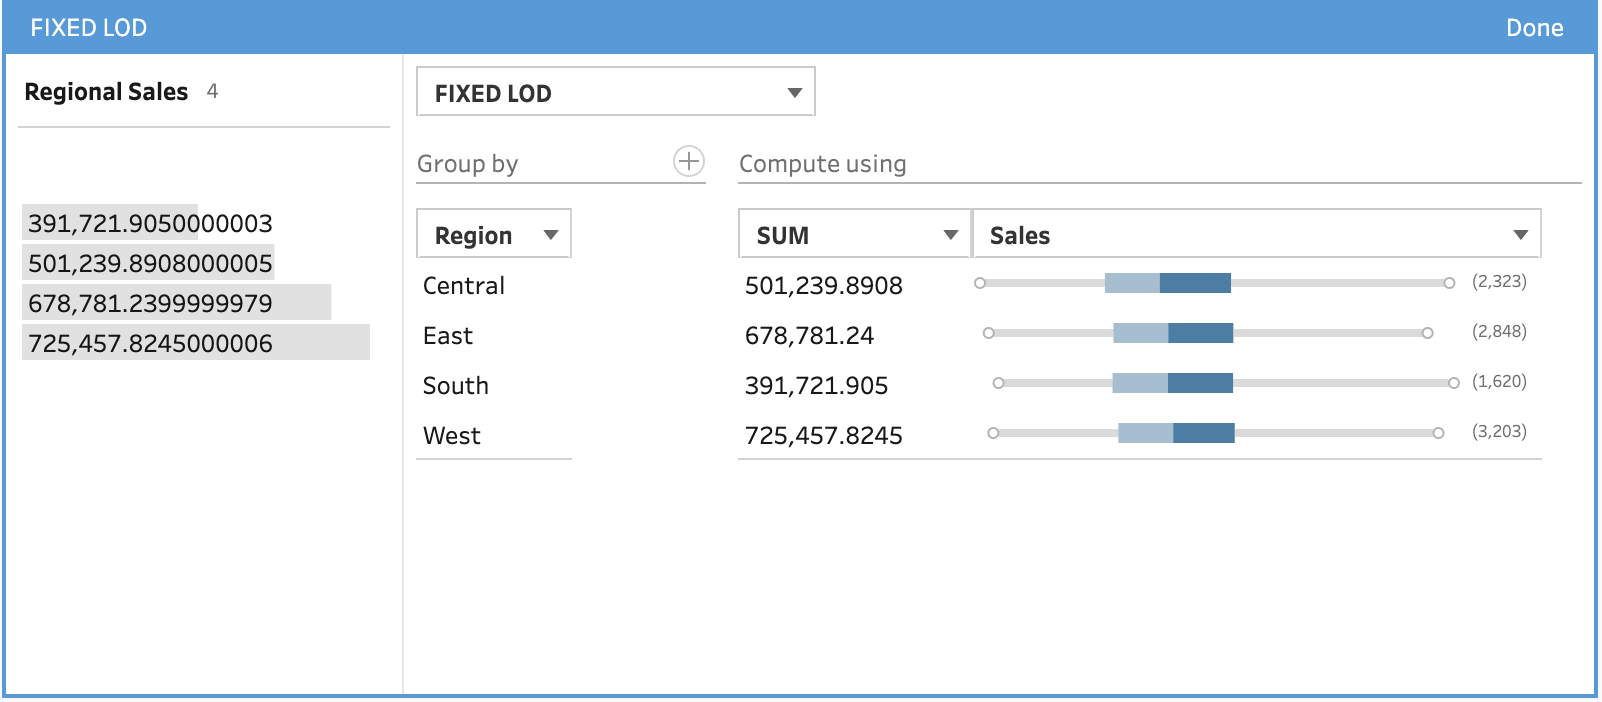
Like the table calculation equivalents, the calculation is made available in the Changes pane if you want to edit it.

In Summary
Tableau Prep was designed to make data preparation tasks more accessible to end users. As the Desktop tool advanced, the features required to complete the variety of tasks you needed to undertake has grown as well. Thankfully Tableau Prep has made a number of those easier to understand and edit. I look forward to the tool becoming increasingly easier to use as more complexity is removed from quite sophisticated functions and processes.