I need… a Moving Average
Intro
When working with Tableau Desktop it can be easily to set-up Table Calculations in the tool itself when you are an experienced user. However, if the users of your dataset aren’t as experienced, Table Calculations can take a lot of trial and error to get write. Also, Table Calculations like Moving Averages are hugely affected by the dimensions in the view. By adding another dimension you can change the values dramatically. Therefore, you could consider adding a moving calculation into your data set before sharing it with users when you know how they will want the values calculated.
The Scenario
You want to create a moving average to capture the total value of the last 10 orders per region to smooth out order fluctuations but see which Region is selling higher order values than the others.
This Prepcipe is completed in 2023.2
The steps
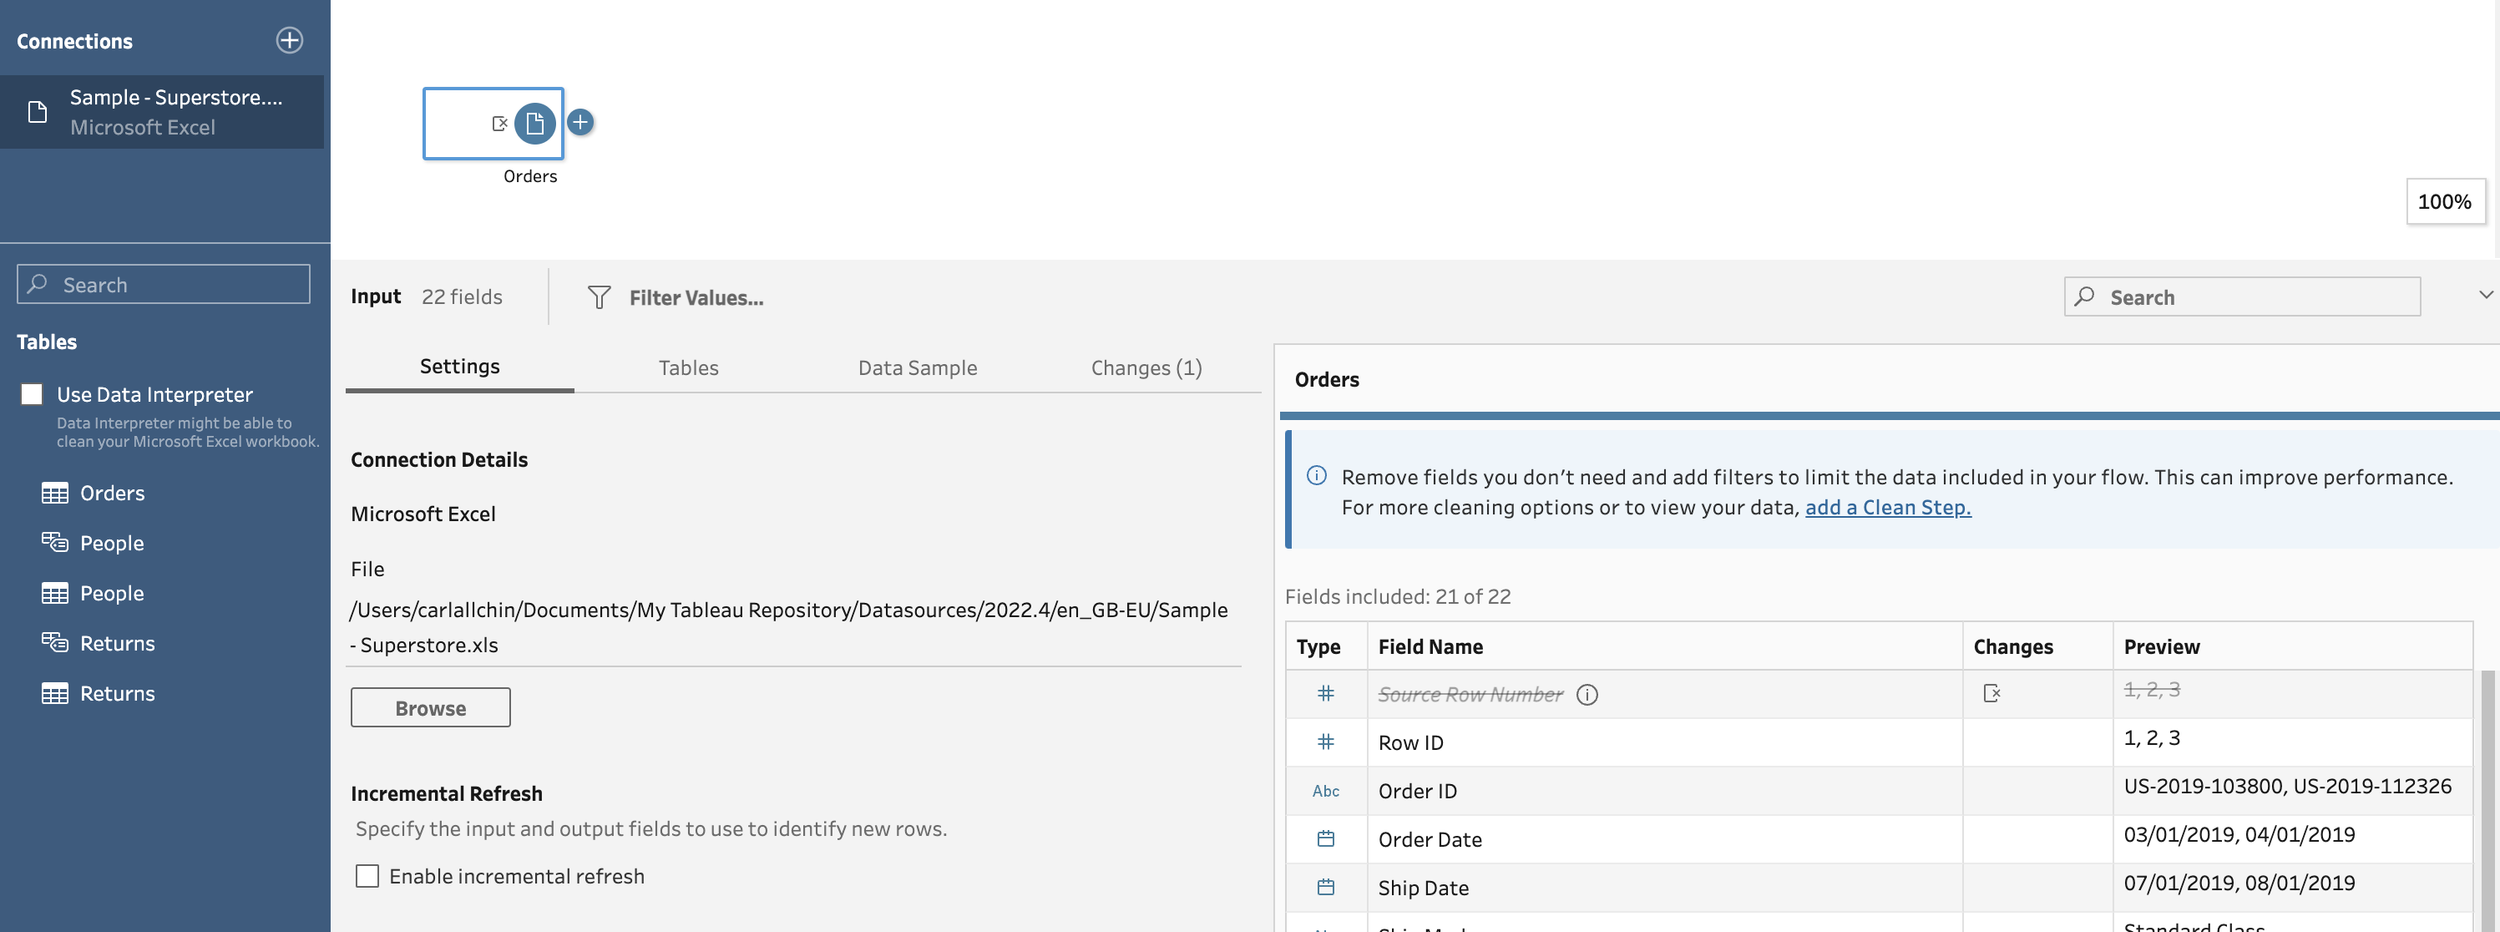
Connect to the Orders table in Superstore Sales in Tableau Prep Builder
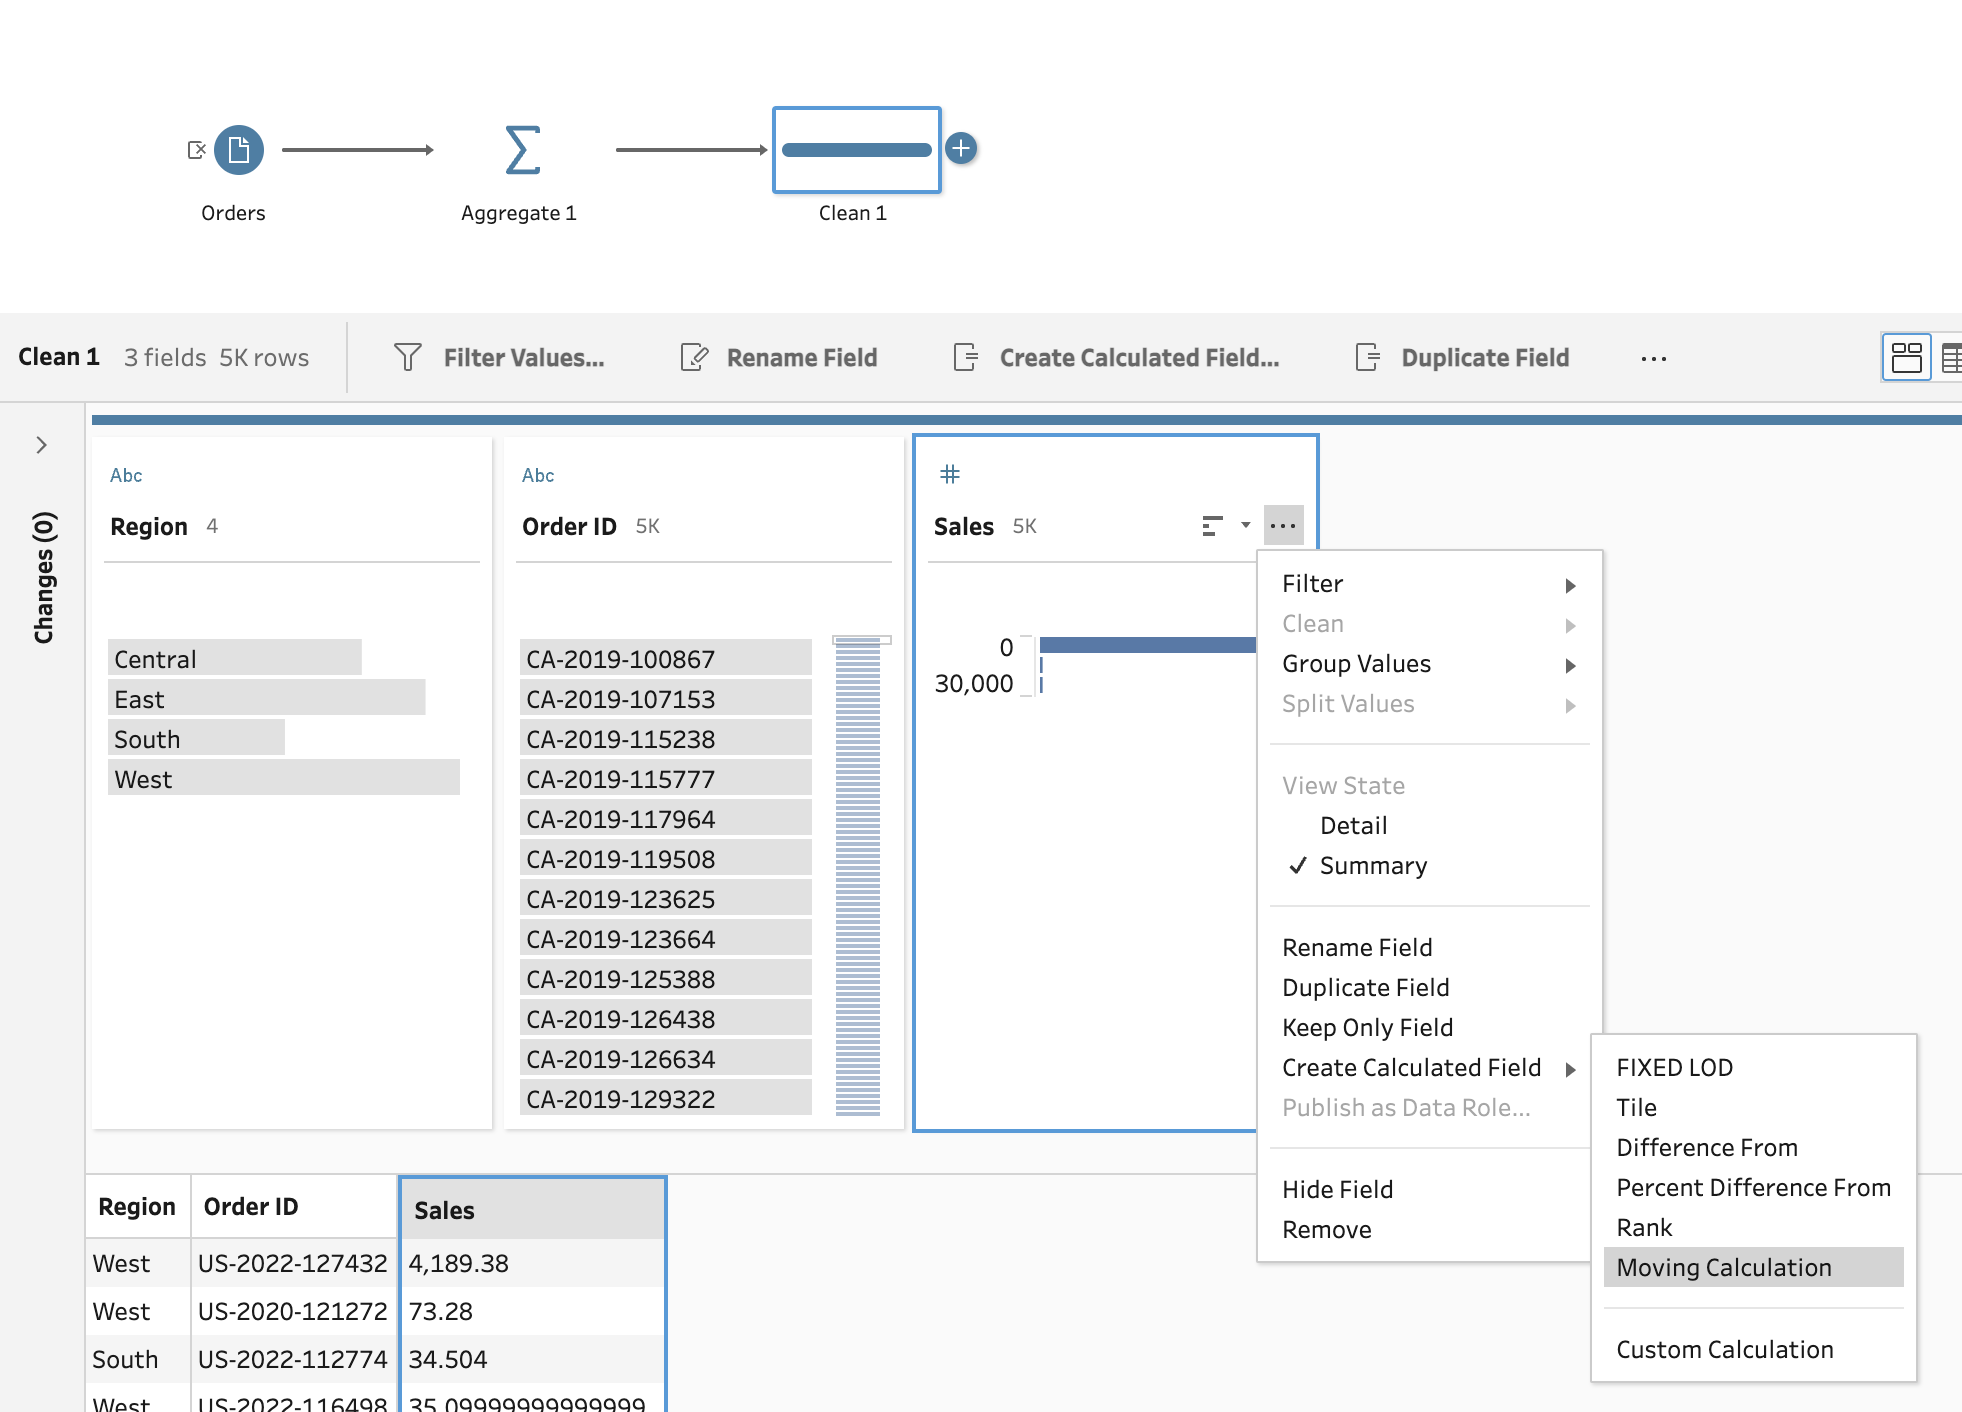
2. Aggregate the data set so each row represents a single Order in a particular Region. You can do this in an Aggregate step. Group By Region and Order ID, Sum the Sales values.
3. Add a Clean step to the flow. Click on the ellipsis menu of the Sales field, click on Create Calculated Field and then select Moving Calculation.
4. Now to set up the calculation to get the last 10 Orders per Region. It doesn’t matter what order you setup the Analytical Calculation but you will need to complete the following steps:
Name - call the calculation Sales Value of the Last 10 Orders
Group By - select Region
Order By - select Order ID
Results - select 9 Previous values (including the current value will make the moving average of the last 10 orders).
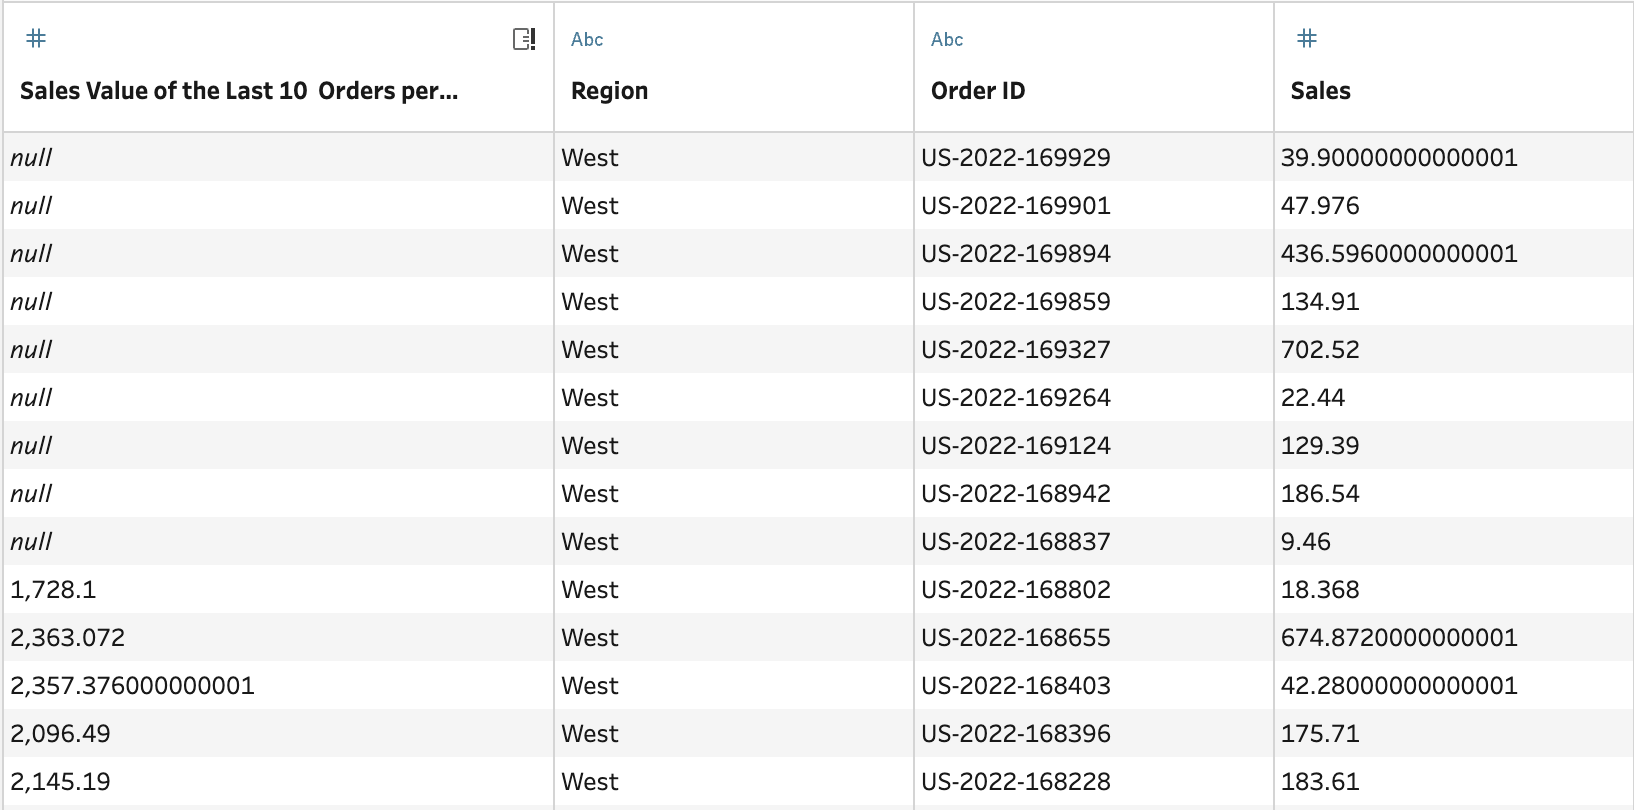
5. Add a Clean step to see the results of the Moving Calculation. Note: you will see nulls for the first 9 rows as the Moving Calculation returns a null until there are 10 values to use in the calculation.
Outcome
You now have a field in your data that has a rolling average of the total sales in the last 10 orders per region.


