
How to… find duplicates in Prep Builder
With the release of Tableau Prep Builder 2024.1 there were a couple of quality of use improvements, one of which I’ve already covered in this post on Setting the Row Header. The other is creating easy to use functionality in identifying duplicate rows in your data set. I’ve written about the techniques you could deploy to identify duplicates previously (actually nearly 4 years ago to the day) — you can see that post here.
_______________________________
One of the best aspects of the working with Tableau Prep Builder is the ability to use the Profile Pane to gain an understanding of your data set. You can see the distribution of categorical and numeric fields, are there any null values in the data field, and what how many rows are there for each value in each field.
The one aspect of investigating a data set that remained difficult to see easily was whether there were any duplicates in the data set. Thankfully, finding those duplicates is a lot easier now with the Identify Duplicate Rows option found in the Clean step.
This blog will use the Superstore data set that come with Tableau Desktop. The version I’m using has 10,194 rows (if you have the 9,994 rows version then you won’t have the duplicates present).
What do we mean by duplicates?
The term duplicate commonly refers to a row (or rows) that are exact copies of another row. Depending on how the data is captured, duplicates can be created due to operational systems downloading errors, data files not overwriting records when they are updated, or data coming from multiple sources and not being checked for duplicates against already uploaded data sets. For example, if a value has been agreed for a project but the scope belatedly changes, if a new row of data is created to capture the new value without removing the previous record, a duplicated row of data will now exist for that project.
Not all duplicates are wrong for existing in the data set. Depending on what the categorical data fields represent will establish whether there should be multiple rows that could be identical and potentially should be identical. Imagine sales of soaps in a store that don’t capture the date or store they are sold in. You are very likely to have the same type of soap, scent sold for the same price. Therefore, those rows shouldn’t be removed as they are duplicates of each other as each represents a different sale each time.
Identifying Duplicates
Spoiler alert - this function isn’t going to do everything in a fool-proof way. To use the functionality well you’re going to have to understand:
Identifiers / keys in data sets
How to define the granularity of a data set
These aren’t straight forward concepts for most users of Tableau Prep or the majority of people who work with data on a day-to-day basis. Let’s briefly describe the concepts and their purpose:
Identifiers - These fields are commonly added to data sets when storing the data in databases. They allow rows in tables to be linked to corresponding rows in other tables. Primary key is the term used to describe a field that has a value that uniquely identifies a record in your data. If a primary key is applied properly, any repetition of any values in your table will be a good idicator there are potentially duplicated fields. There are other keys that may duplicated, called Secondary Keys, which are used to join other tables together.
Granularity - The term to describe how detailed the rows in the data set are of the instances they are recording. Data sets categorical fields are the descriptive data points that define what the instance is recording. Therefore, to find the granularity of a data set you need to see what categorical fields are uniquely describing each row. For example, if you were capturing a row of data on class attendance for each school day you taught at a school, the date would be the categorical field describing the granularity of the data set. If you had dates repeat, you’d know there were issues in your data set.
From the descriptions above, you might be getting the idea that you need to understand both concepts to determine if you data set does have duplciates within it. If your data set has a primary key field but there are duplicated values within that field then it’s very likely you have duplicate rows of data and you will need to decide which to remove. If no key is present and you can identify the categorical field, or fields, that set the granularity, any duplication in the values of those fields will highlight a duplicate record has occurred.
Using Prep Builder to identify duplicates
Now you understand the key concepts when working with duplicated data, let’s look at how you can now use Prep Builder to identify the duplicated rows in your data set. There are multiple places you can select the Identify Duplicate function within the Prep Builder tool:
All of the data
In all likelihood you use a Clean step to investigate your data set when you first load it into Prep. This enables you to see how the data has loaded, understand the profile of the data and gain an overview of what changes you might need to make. The new Identify Duplicate Rows option is offered on the grey bar at the top of the Profile Pane. You might notice the icon next to the wording is that of a calculation. Therefore, Prep is writing a calculation to identify duplicates in the data set. Let’s get to the calculation Prep writes later.

The results of clicking Identify Duplicate Rows are shown as a new field that will appear on the left-hand side of the Profile Pane. There is no configuration for you to do, Prep will automatically create a calcualtion to determine whether there are any duplicate rows.

The field Is Duplicate Row? has been created to show the results of the calcualtion assessing whether any duplicates have been created. In this case the results of the calcualtion show all the rows to be unique. At this point you might be wondering why I wrote this post on duplicates using a data set with no duplicates… Don’t worry you haven’t wasted your time reading this far as there is more complexity in this data set than this functionality has initially identified. To understand what Prep has done, I’ll choose to edit the calculation from the Changes pane (shown collapsed in the image above). The calculation written is:

At first glance, this isn’t the easiest calculation to understand but let’s reformat the calculation to make it a little easier to read.

Here’s how I interpret this calculation:
The calculation is an IF statement,one of the logical calculations. This means that the calcualtion will set a condition to test and depending on the output will share a result as to whether that condition is met, and offer an alternate output if the condition is not met. The END term jsut ends the logic statement so can be ignored.
The use of the curly braces, PARTITION and ORDER BY shows Prep is writing an analytical calcultion. In this case, the calcution is using the ROW_NUMBER function which applies a running number within a partition of rows.
The rows are being partitioned, or grouped to use another term, by the combination of every data field in the data set. This means that for every row, where the exact same values exist in each field, will be grouped together.
The ORDER BY function is ordering the rows within each position by the Row ID field
The argument being set in the inner curly brace is looking at rows where there is only one row with those values or the first row in a partition of rows that have a set of values. Where these rows are identified as the first or the only one, they’re given the value 1.
The DESC term means that the rows are order from largest to smallest value found in the Row ID
The THEN gives the output from the calcualtion where the value of the row number is 1 as ‘Unique’. Otherwise the value of ‘Duplicate’ is returned.
So a lot is happening in the calculation. You could have written this calculation yourself for the last couple of years of Prep versions but for most users this wouldn’t be an easy task so I’m glad the new functionality is doing the lots of hardword for you.
However, what the function is doing isn’t right for this data set!
The use of Row ID in the calculation means that it is very unlikely to find any duplicates as Row IDs are normally a type of Primary Key that generates a unique value per row. This means that as the Row ID has been used in setting the partitions, you’d be very unlikely to have any duplicates.
So let’s remove the Row ID and see the affect on the results:

Now we can see a couple of duplicate rows have been identified. By selecting the ‘Duplicate’ value in the Profile pane you will be able to see the duplicate rows in the Data pane underneath the Profile pane.

The two rows being shown are those that are classed as being duplicates but you don’t get to see the row that they are same as. Those will be given the value of ‘Unique’ in the ‘Is Duplicate Row?’ field. If you found the similar record, the values for all of the columns would be the same so it isn’t necessary to check. If you wanted to, I’d recommend selecting a field that might set the granularity like Order ID, right clicking on the value in the Order ID field for the duplicate and selecting ‘Keep Only’. When you deselect the ‘Duplicate’ value, your data set will only contain the rows of data about that Order ID. For example, I’ve selected to only retain Order ID ‘US-2020-150119’.
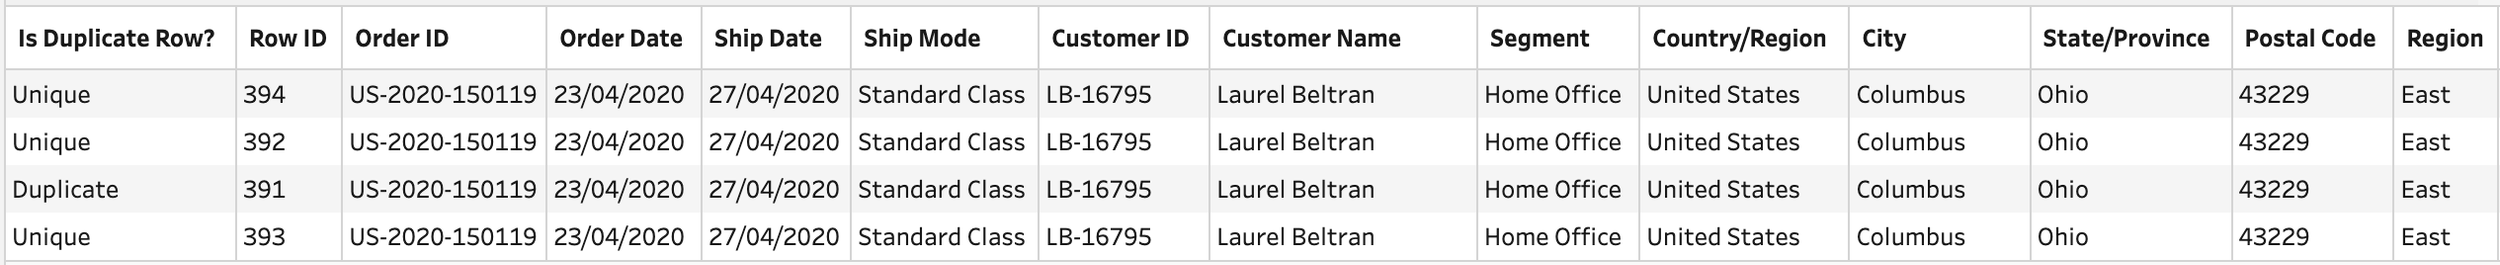
Our eyes are amazing at spotting differences in blocks of text so my eyes quickly can see most values in the columns are the same except for a couple of columns:
Row ID - this is why these rows weren’t identified as duplicates when we first tried to use the function
Is Duplicate Row? - only one of the values are showing as a duplicate
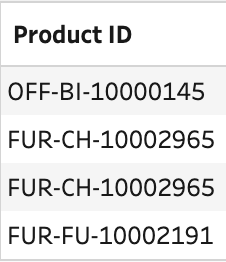
So why is only one row showing as a duplicate? If you scroll through the data pane you’ll be able to see there are three different products sold for these four rows of data.
The third row in the data pane was identified as the duplicate as its the second row when the data is partitioned by all the fields except Row ID. Therefore, finding a truly duplicate row isn’t easy when your data set contains a field being used as a Primary key.
If you’re following along, don’t forget to delete the Clean step we’ve been using so far as we’ll explore whether there are easier ways to use the new functionality to find duplicate rows in our data set.
Multiple Data Fields
If you can’t assess all the rows due to the presence of a primary key then you will need to determine what categorical field or fields set the granularity of your data. The profile pane can help you do this as you’d look for a data field which has just a single row for each value found in the data set. The histogram in grey behind the values shown in the profile pane, or the mini-histogram shown to the side of the data field where there are too many values to show within the height of the Profile pane.
If you scan through the Superstore data set, it’s only Row ID that will appear to give you what you’re looking for.

As we’ve covered, Row ID isn’t going to help us identify the potential duplicates. Therefore, you need to spend time with the data to identify what categorical data fields set the granularity in the data set. This involves thinking through the subject of the data and checking suspected relationships between the data fields.
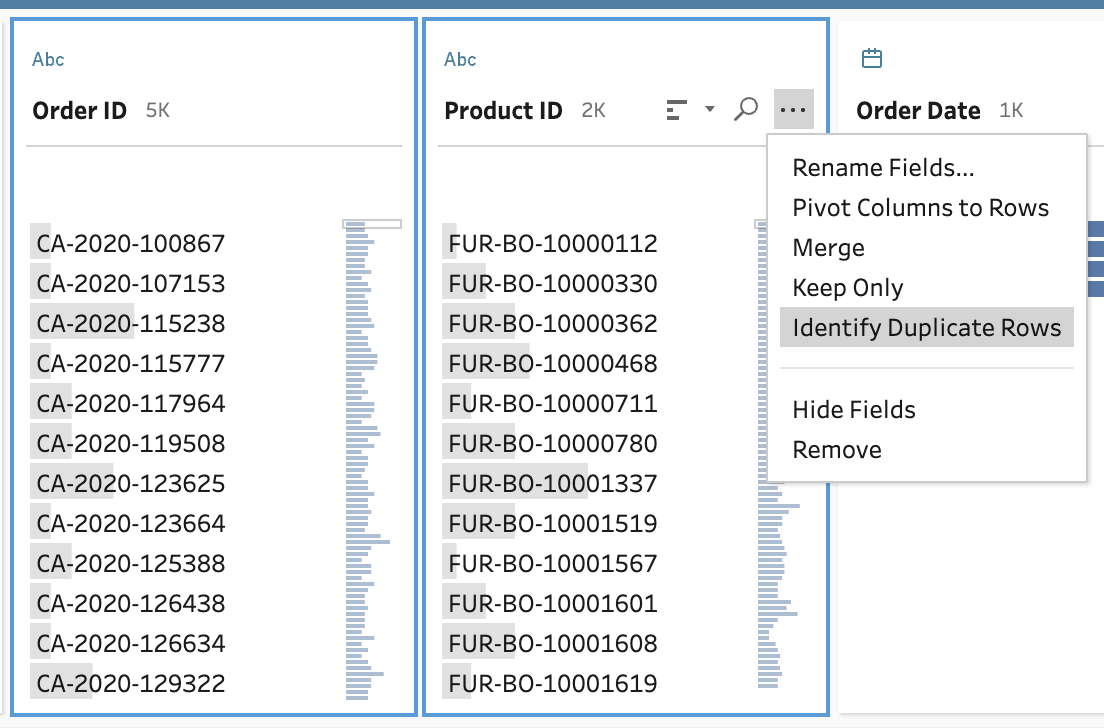
For example, our data set is about the Orders placed at the Superstore. Therefore, an identifier focused on each order would be a good starting point. The field Order ID exists in our data set so let’s look at the profile of that data field.

The length of the bars in the histogram demonstrate the number of rows for each Order ID. With a mix of lengths, Order ID alone doesn’t define the granularity of the data set. This makes sense as hopefully our customers are buying multiple products in each of their orders. With the same logic, we’d hope each product we sell isn’t bought by just one customer so Product ID alone is also not enough to define the granularity of the data set. Superstore’s granularity can be defined by the combination of Order ID and Product ID, i.e. the products sold within each order. You can select Order IDs with multiple rows of data and then see how Product IDs are different for each row in the selection.
Once you’ve identified what sets your granularity then it’s time to see if there are any duplicate rows in your data set than those which we’ve identified so far. Previously we found 2 rows when assessing all the values in each data field against each other once we stopped partitioning the data by Row ID. Let’s see the effect this time of just using the Identify Duplicate Rows functionality by just partitioning on just Order ID and Product ID.
You don’t need to write this calculation from scratch. You can select both fields by holding down the CTRL (or the command key if you’re using a Mac) and left click the fields that you want to include in the partition (note: for this screenshot I have moved the Product ID to be next to Order ID in the Profile pane). Once you have the field(s) selected that set your granularity of your data set then you should left click on one of the ellipsis menu of the fields selected and select the Identify Duplicate Rows option in the menu.
As per before, the functionality will write a calculation and produce a new data field called Is Duplicate Row? This time you might be more surprised to see that there are 11 rows that are identified as Duplicates compared to the 2 rows identified before. By filtering to leave only the duplicates, we can see one order actally has two different combinations of Order ID and Product ID that are identified as duplicates (remember one of each copy will be shown in the data set as unique).

By removing the filter on the records that are shown as Duplicates, we can analyse this particular Order. When doing so, all the categorical except Product seem to be the same. There are only two different products sold so why are there four different rows? The Data pane shows there are different values captured for the Sales, Quantity and Profit fields for the two different products sold.

This is why you should never partition by the measure values in your data set when assessing duplicate rows. There’s good reasons why this order may have been updated as the customer may have noticed they ordered the incorrect amount of each product and then amended the order. The data source should have been overwritten as we only look at the end sales position in this data set but for some reason it hasn’t happened.
Before removing the values recorded as duplicates by Prep Builder, it’s worth thinking through your organisation’s purpose for collecting the data. In Superstore’s case, we want to see what products customers have purchased in each order so we’d want the latest row where duplicates are found. Therefore, the descending function (DESC) is the correct one as long as Row ID is added sequenitally so it will allocate the Unique title to the latest version of the row in the data set.
Summary
The new functionality to Identify Duplicate Rows is really useful. You can see the complex calculations required to identify duplicates. As Prep Builder is writing those for you, this feels like a useful feature. However, there are a number of key aspects of identifying and removing duplicates that aren’t included in the set-up of the functionality. It would be easy to either miss duplicates in your data set or misidentify the categorical fields that define the granularity of your data set. Hopefully the steps I’ve laid out above allow you to understand the steps you need to take to identify duplicates and not just rely on clicking on Identify Duplicate Rows and assuming Prep Builder will find all the potential duplicate rows for you.